

All's Well That Ends Well
at least sometimes 🐈

Hi!
Although some of my data did truly disappear from Earth last week, I have people who are kind enough to re-run the analyses and bring the data back from the bottomless abyss, which makes my life so much easier 🙏.
Also, chicks hatched, and I hear the gang chirp in our lab every day (fear not, they will go on to spend their life in the garden once they are big boys and gals who don’t need the lamp anymore).
Our field season is almost in full swing, so here is a relaxing R exercise. For that, we will use the CatterPlots:
#### Install the CatterPlots package and load it ####

library(devtools)
install_github("Gibbsdavidl/CatterPlots")
library(CatterPlots)

#### Enjoy ####

numbers <- 1:100
x <-numbers[seq(1, length(numbers), 8)]
y <- numbers[seq(1, length(numbers), 8)]
purr <- catplot(xs=x, ys=y, cat=3, catcolor='#FFA500',
                xlab="like to jump", ylab="Cats", main="Cats will be cats")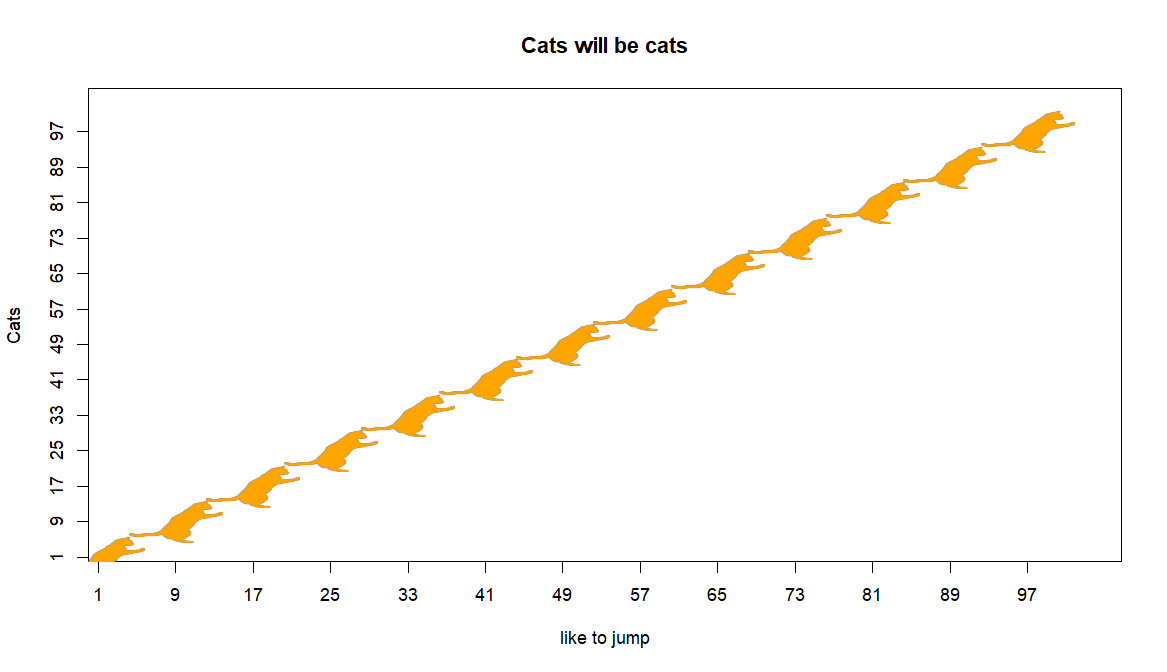
It actually takes some time to master the positioning of the cats, so you may want to come up with equations that best describe the spirit of your emotional support animal.
Carpe diem,
Aga
PS: Here is the survey in which you can tell me what R topic you find particularly confusing and why you want to learn it so that we can shape this space together!